More Statistics
Today we want to share some more visual aid statistics with you. We are continuing with year to year comparisons covering 2006-2011. These graphs are to show the change in average sale price from year to year.
First we compared the average sale price for each year based on the number of bedrooms in a residential home.
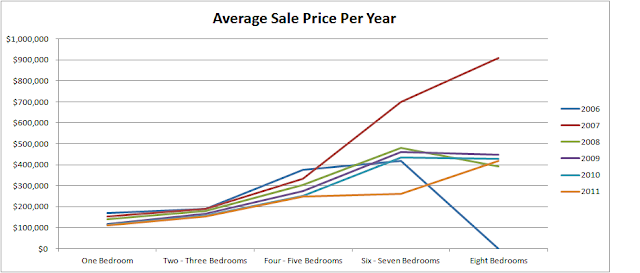


First we compared the average sale price for each year based on the number of bedrooms in a residential home.

Average Sale Price Based on # of Bedrooms (2006-2011)

Average Sale Price Based on # of Bedrooms (2006-2011)
The follow is the comparison of the total average sale for 2006-2011.


The total average sale price has declined since 2006 as we saw with total volume of sales it has been consistent in the last 3 years.


Comments